
ESG-Report
Globe Systems A/S
Globe Systems A/S
CVR DK 25986679
Complied in accordance with the EU's voluntary standard - VSME
Complied in accordance with the EU's voluntary standard - VSME
46.50: Wholesale of information and communication equipment

Foundation of the Report
Framework and Methodology for ESG Reporting and CO₂ Accounting
- Organizational and Operational Boundaries:
This report covers the entirety of Globe Systems A/S and includes all activities and locations under our operational control. This includes our headquarters and warehouse facilities located at Pi 2, 8382 Hinnerup, Denmark, as well as data from our satellite office at Kirkebjerg Allé 86A, 2605 Brøndby, Denmark. Since we lease office space at the Brøndby location, consumption and CO₂e impact have been estimated based on average values. This is done to present the most accurate picture of Globe Systems A/S’s total consumption. The reporting follows the EU’s voluntary VSME standard, where we include emissions and consumption from locations which we have direct influence over. - Data Sources and Documentation:
Data has been collected from a variety of internal and external sources, including:- Internal accounting and HR systems
- Electricity, heating, and mileage records
- Information from suppliers
- Manual calculations of transport, consumption, and waste
Scope of the Report
- Strengthen transparency in our business
- Document and improve our efforts in areas such as climate, working conditions, and business ethics
- Contribute to a digital future where responsibility and sustainability go hand in hand with technological development
This report is therefore both a status update and a starting point – part of our continued efforts to integrate ESG as a natural component of our business strategy and value creation.
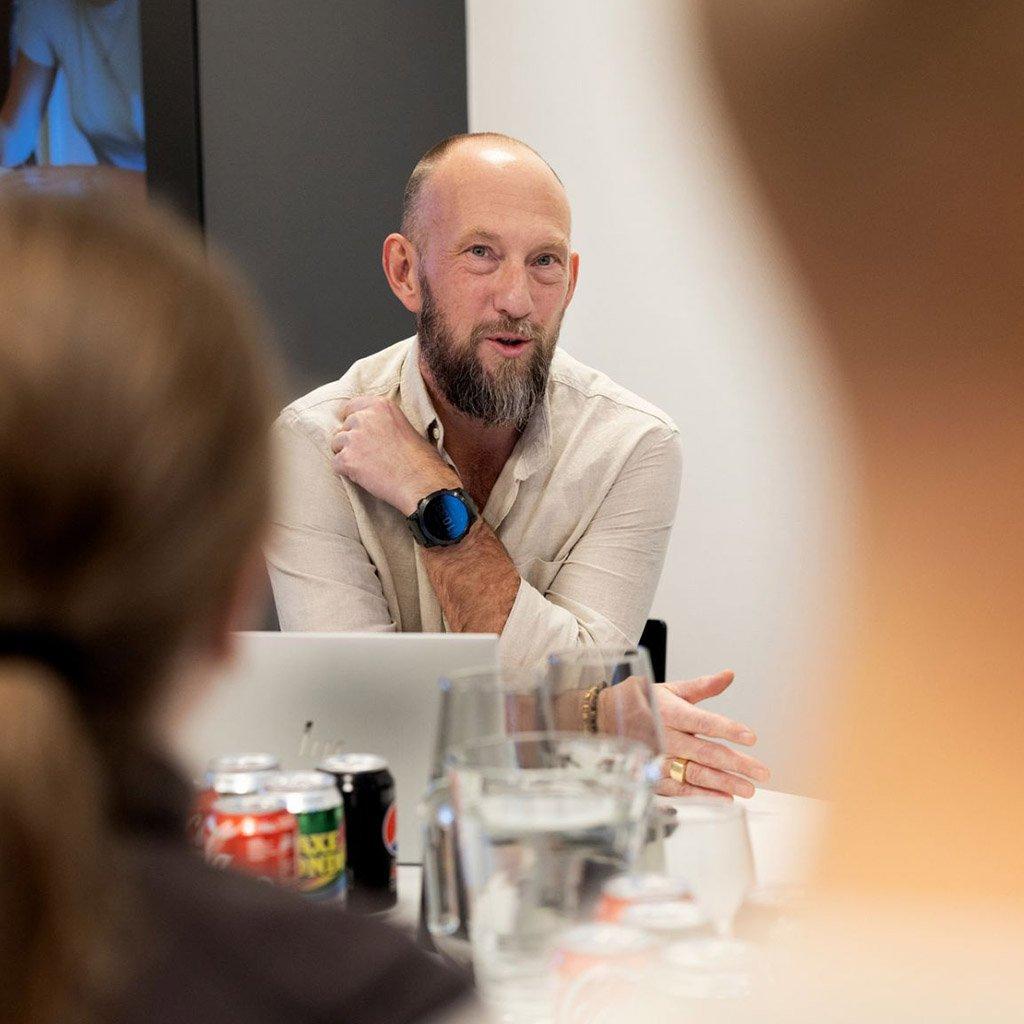
A Message from Management
A Sustainable Future
- minimize the CO₂ footprint across the entire product lifecycle,
- require our suppliers to comply with ethical standards, and
- prioritize partnerships with companies that share our focus on social and environmental responsibility.

Globe Systems Refurb
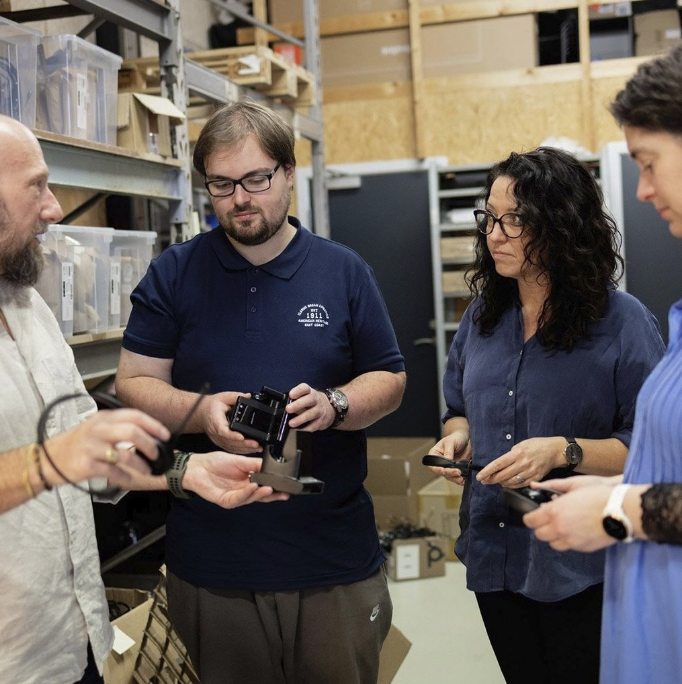
- With Globe Systems Refurb, we actively work to extend the lifespan of IT equipment and reduce electronic waste. The Refurb program is our tangible contribution to the circular economy: instead of sending used equipment to disposal, we receive it back from our customers, assess its quality, refurbish it, and reintroduce it to the market.
- Refurb is an alternative to buying new and can significantly reduce the environmental impact per unit, as the production of new equipment typically results in considerable CO₂ emissions. In 2025, we aim to document the average environmental savings per refurbished unit in collaboration with our suppliers.
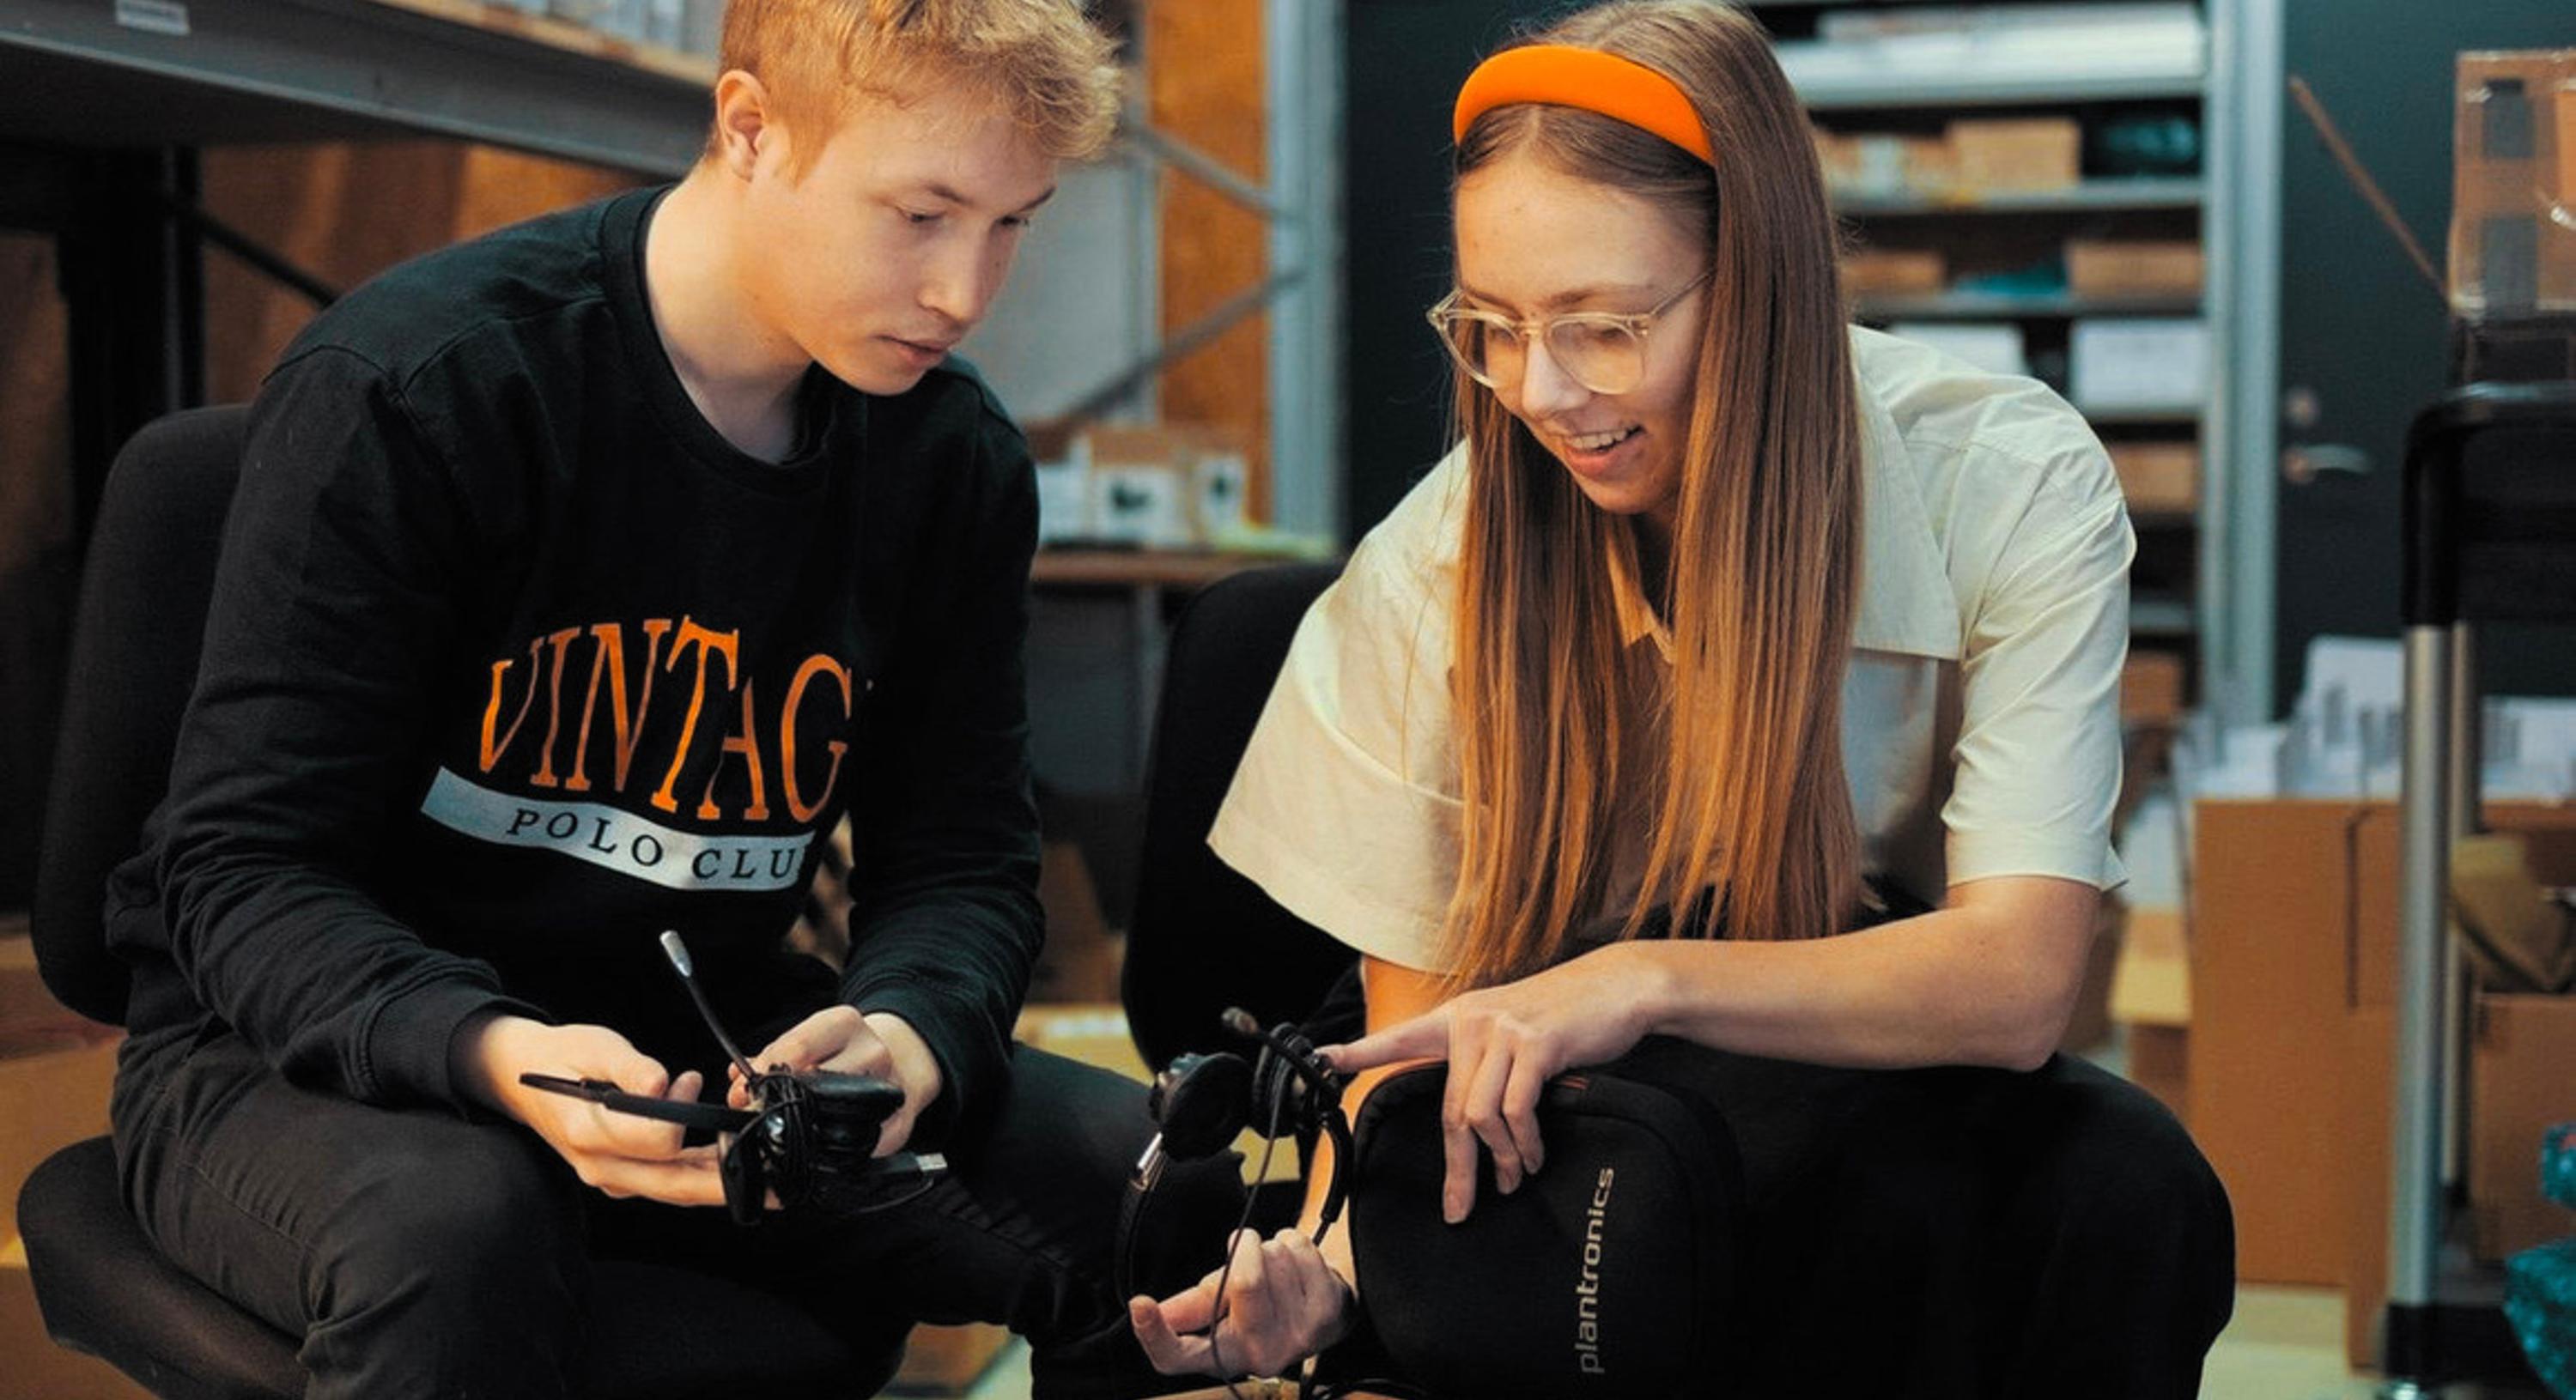
- The Refurb process is carried out in close partnership with Special Minds, a social enterprise. Here, the equipment is prepared for resale by employees on the autism spectrum, working under structured and supportive conditions. This collaboration supports both environmental and social sustainability.

Certifications
- the use of 100% green electricity at our headquarters,
- the implementation of Globe Systems Refurb, which aims to extend the lifespan of IT equipment,
- the optimization of packaging and transport through consolidated shipping solutions.
Our Approach to Sustainability – Present and Past
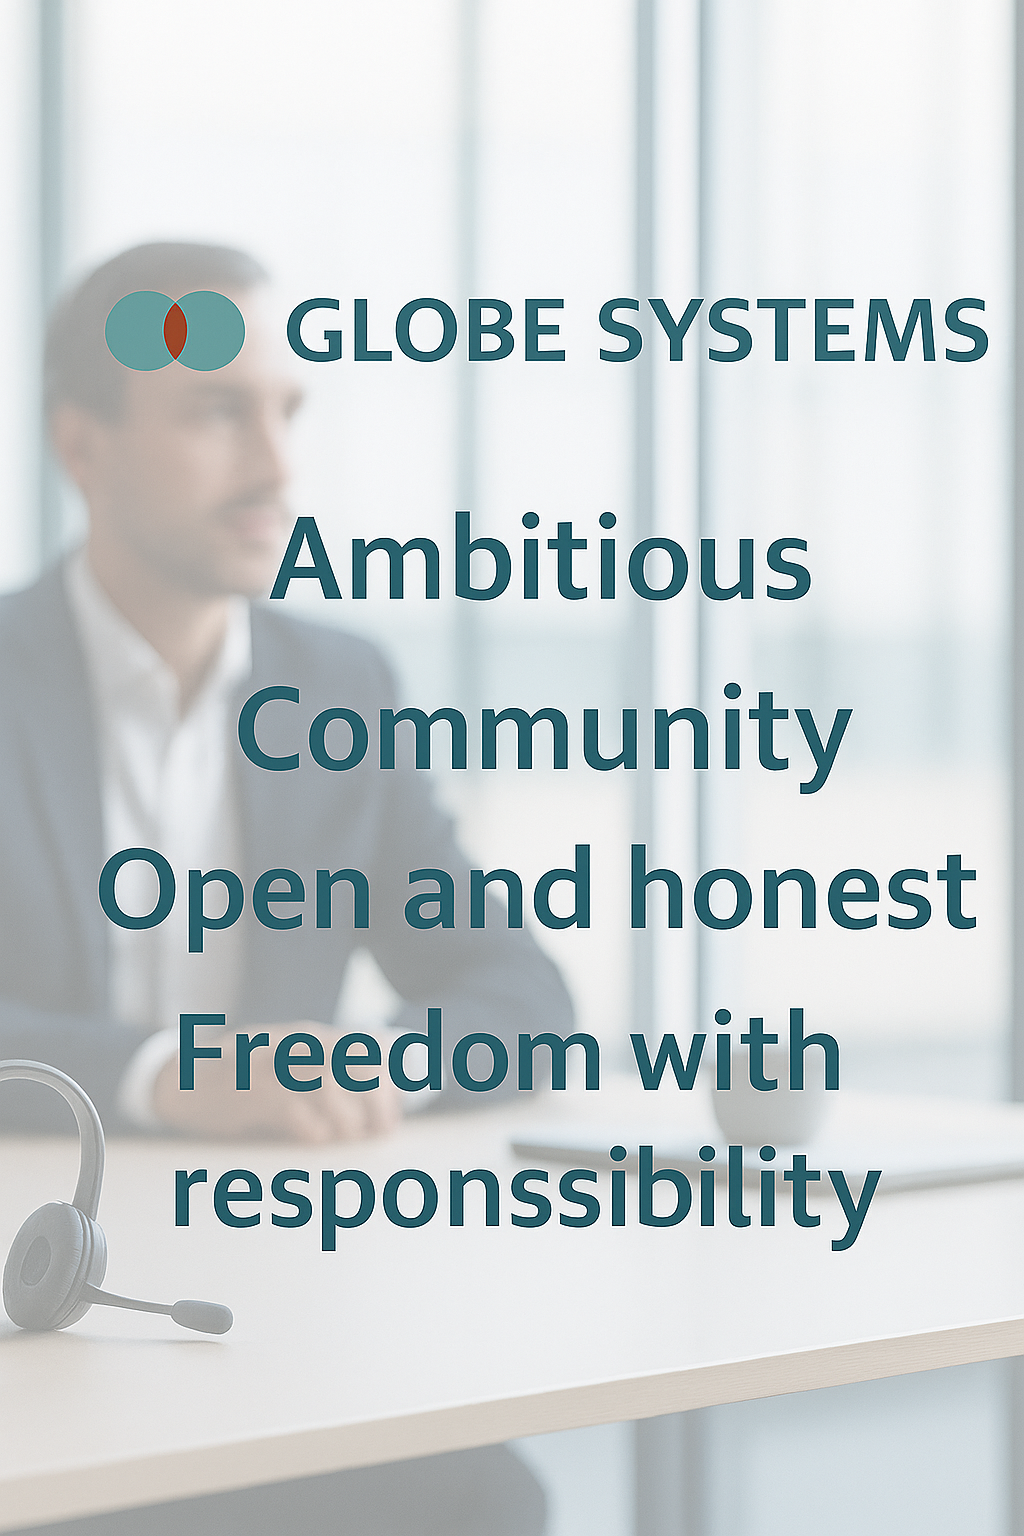
Sustainability in Vision, Strategy, and Core Values
Bæredygtighed i vision, strategi eller værdigrundlag
| 2022 | 2023 | 2024 | |
|---|---|---|---|
| Sustainability is written into our vision, strategy, or values. | – | – | |
| We are working on sustainability, but it is not written into our vision, strategy, or values foundation. | – | – | |
| We are not working on sustainability, but we plan to do so in the future | – | – | |
| We do not work with sustainability | – | – | – |
Sustainability in Vision, Strategy, and Core Values - Continued
Politikker eller initiativer for områder der bidrager til bæredygtig omstilling
| 2022 | 2023 | 2024 | |
|---|---|---|---|
| Climate change | – | ||
| Pollution | |||
| Water and marine resources | – | – | – |
| Biodiversity and ecosystems | – | – | – |
| Circular economy | |||
| Own workforce | – | – | – |
| Workers in the value chain | – | – | – |
| Affected communities | – | – | – |
| Consumers and end users | – | ||
| Corporate governance | – | – |
Energy consumption
MWh
2024
Energy consumption from fossil sources
MWh
2024
Share of renewable electricity consumption.
Energy Consumption
- Replacing lighting with energy-efficient LED bulbs,
- Installing motion sensors to avoid unnecessary energy use,
- Raising employee awareness around daily energy habits.
Energy Consumption - Historically
| 2022 | 2023 | 2024 | |
|---|---|---|---|
| Energy consumption | 247 | 260 | 242 |
| Energy consumption from fossil sources | 222 | 237 | 216 |
CO₂e Emissions
CO2e scope 1
ton
2024
CO2e scope 2 location-based
ton
2024
CO2e scope 2 market-based
ton
2024
The company's total location-based CO2 emissions
ton
2024
| 2022 | 2023 | 2024 | |
|---|---|---|---|
| The company's total location-based CO2 emissions | 52,2 | 60,0 | 56,0 |
| The company's total market-based CO2 emissions | 60,2 | 69,6 | 67,0 |
| CO2e scope 1 | 33,4 | 40,7 | 37,5 |
| CO2e scope 2 location-based | 6,38 | 4,97 | 4,73 |
| CO2e scope 2 market-based | 14,4 | 14,6 | 15,7 |
CO₂e Footprint per Employee:
- 2022:
Market-based emissions: 2.87 tons CO₂e
Location-based emissions: 2.49 tons CO₂e - 2023:
Market-based emissions: 3.03 tons CO₂e
Location-based emissions: 2.61 tons CO₂e - 2024
Market-based emissions: 2.39 tons CO₂e
Location-based emissions: 2.00 tons CO₂e
CO₂e Relative to Revenue:

Biodiversity-sensitive locations
2024
Biodiversity-sensitive area
m²
2024
Biodiversity
However, we are open to contributing to biodiversity-enhancing initiatives in the future—either at our own locations, for example by increasing natural elements in outdoor areas, or through partnerships with relevant stakeholders. As our ESG efforts evolve, we will continuously assess where it makes the most sense and adds the greatest value for us to engage.
Biodiversity – Continued
Total use of land
ha
2024
Total sealed area
m²
2024
Nature-oriented area on-site
m²
2024
Nature-oriented area off-site
m²
2024

Water consumption
m³
2024
Recycled or reused water
liter
2024
Water consumption
Water consumption - Historically


Resource Consumption, Circularity, and Waste Management
We actively work to reduce waste and extend product lifespans, including through:
- Product maintenance and spare parts: We continuously offer service and replacement of wear parts such as batteries, cables, and ear pads, so products can be used longer instead of being replaced.
- Waste sorting and recycling: We sort our waste into relevant fractions for recycling, including cardboard, electronic waste, hazardous waste, and food waste. Cardboard is the largest waste category and is prepared for external recycling.
- Circular business models: Our Globe Systems Refurb program contributes to reusing used IT equipment that would otherwise be discarded.
In 2024, we generated a total of 14,586 kg of waste, with a large proportion consisting of cardboard. Hazardous waste such as electronic scrap is handled and sorted separately to enter certified recycling processes. We also sort food waste, which is collected and sent for composting, where it is recycled as soil improvement.
We continuously work to improve our data collection and reporting in this area to systematically monitor developments and set concrete reduction targets going forward.
Amount of waste generated
kg
2024
Amount of hazardous waste generated
kg
2024
Amount of waste prepared for recycling
kg
2024
Amount of waste reused
kg
2024
| 2022 | 2023 | 2024 | |
|---|---|---|---|
| Amount of waste generated | 5.269 | 7.677 | 14.586 |
| Amount of hazardous waste generated | 9,00 | 2,00 | 991 |
| Amount of waste reused | 0,00 | 0,00 | 0,11 |
| Amount of waste prepared for recycling | 2.885 | 4.338 | 8.087 |
The table above shows in numbers how the quantities have changed over time.
The significant increase in hazardous waste is primarily due to the introduction of our Globe Systems Refurb program, where we collect products that would otherwise have been discarded. After collection, everything that can be reused is sorted out, while the remaining waste is sorted and then either recycled or incinerated.
Full-time employees
2024
Departed employees
2024
Employee turnover
Workforce
From 2022 to 2024, we have not employed any staff on temporary contracts.
Furthermore, there have been no work-related accidents or fatalities during the same period.
Number of male full-time employees in the company
2024
Number of female full-time employees in the company
2024
Gender pay gap
Gender pay gap
Men : Women
2024
Workforce and Compensation Structure
Regarding compensation structure, we measure the difference between the average salaries of women and men across the organization. The current pay gap is primarily due to differences in seniority and job categories, as many of our female employees have been recruited in recent years. We continuously monitor the development of the pay gap and will strengthen our focus on equal pay principles as we further professionalize our HR data and processes.
We are also aware that gender is only one dimension of diversity, and we strive to create an inclusive work environment that embraces a wide range of ages, backgrounds, and skills.

Ratio between starting salary and minimum wage
2024
CEO salary discrepancy
CEO : Employees
2024
Employees covered by collective bargaining agreements
Compensation & Collective Agreements
Currently, none of our employees are covered by a collective bargaining agreement, as Globe Systems A/S is not a unionized company. However, we adhere to guidelines and recommendations from the Confederation of Danish Industry (Dansk Industri) to ensure that employment terms—such as vacation, pension, working hours, and notice periods—meet standard industry practices.
We also report the ratio between the average employee salary and the CEO’s salary to maintain transparency regarding internal pay disparities. This pay ratio will be monitored and evaluated as part of our ongoing ESG data reporting

Average number of hours female employees have received training
2024
Average number of hours male employees have received training
2024
Sick leave
Sick leave
7.4 Days/FTE
2024
Education and Sick leave
In recent years, all employees have participated in continuing education, with a minimum of 2 hours of mandatory professional development annually, covering leadership, technical skills, and personal competencies. We continuously work to foster a strong learning culture where employees’ individual wishes and needs play a central role, and we focus on creating flexible frameworks for further education.
At present, we have chosen not to set an overall target for training hours, as we want to tailor efforts to each employee’s development opportunities and the company’s needs. We plan to monitor employee satisfaction and learning outcomes through regular evaluations.
Regarding sick leave, our average absence rate is 4.57 days per employee per year, which aligns with national and industry averages. We actively work on well-being and health promotion initiatives to ensure a good working environment and to prevent illness.
Men on the board
2024
Women on the board
2024
Presence at board meetings
Responsible Leadership
We continuously measure employee and leadership engagement through annual surveys, which are integrated into our leadership dialogues and development plans. This ensures that management not only communicates our corporate DNA but also lives it in practice. Our board actively participates in ESG-related decisions and ensures responsible governance, contributing to a transparent and engaged organization at all levels.
Workforce and Compensation – Historical Overview
| 2022 | 2023 | 2024 | |
|---|---|---|---|
| Full-time employees | 21,0 | 23,0 | 28,0 |
| Gender pay gap | 1,53 | 1,55 | 1,60 |
| CEO salary discrepancy | 1,80 | 1,75 | 1,89 |
| Ratio between starting salary and minimum wage | 1,02 | 1,03 | 1,02 |
| Number of recordable work-related accidents | 0,00 | 0,00 | 0,00 |
| Employees broken down by gender | 17,6 | 18,7 | 21,7 |
| Employees broken down by gender | 3,08 | 4,51 | 6,42 |
| Departed employees | 0,07 | 1,03 | 1,78 |

Convictions for the violation of anti-corruption and anti-bribery laws
2024
Confirmed cases of corruption
2024
Corruption and Bribery
UN Sustainable Development Goals
Health and Wellbeing
We must ensure a healthy life for everyone and promote well-being for all age groups
Quality education
We must ensure everyone has equal access to quality education and promote everyone's opportunities for lifelong learning
Sustainable Energy
We must ensure that everyone has access to reliable, sustainable, and modern energy at an affordable price
Decent Jobs and Economic Growth
We should promote sustained, inclusive, and sustainable economic growth, full and productive employment, and decent work for all
Industry, Innovation and Infrastructure
We must build robust infrastructure, promote inclusive and sustainable industrialization, and support innovation
Responsible Consumption and Production
We need to ensure sustainable consumption and production
Climate initiative
We must act quickly to combat climate change and its consequences
UN Sustainable Development Goals – Detailed Focus
We prioritize both physical and mental well-being among our employees. In 2024, we conducted a mental health survey in which 85% reported satisfaction with their work-life balance. Our flexible work model, based on the value of “freedom with responsibility,” allows employees to adapt their working hours to fit their personal needs. We aim to increase employee well-being scores by 5% by 2026 through ongoing monitoring and enhanced health initiatives.
We invest in continuous professional and sustainability-related education for all employees. In 2024, each employee completed an average of at least 2 hours of further training. By 2030, we aim to increase the total hours allocated for continuing education, tailored to individual development opportunities and company needs, and to include sustainability training as a permanent part of the program. We also support apprentices and interns through structured onboarding, which we evaluate annually for quality and relevance.
We use 100% green electricity at our headquarters in Hinnerup and are working to extend this to our second location by 2027. We have begun transitioning our vehicle fleet to electric vehicles, aiming for a 100% electric fleet by 2030. Additionally, we continuously optimize energy use through LED lighting and motion sensors.
We ensure decent working conditions throughout our value chain by requiring suppliers to comply with our Code of Conduct or equivalent standards. By 2025, we aim to audit 60% of our primary suppliers with a focus on working conditions and ethics, and expand coverage to 90% by 2030. Internally, we monitor salaries and employment conditions to ensure fair and competitive terms.
We drive innovation with a strong sustainability focus. In 2024, our Globe Systems Refurb program extended the lifespan of over 2,000 IT products, contributing to the reduction of electronic waste. Our “Sammenpak” initiative has helped reduce packaging and transport needs, although the exact CO₂e savings have not yet been calculated. We also promote increased use of AV solutions, which in 2024 contributed to a reduction in physical meetings. However, we do not have precise data on the actual reduction in our customers' travel.
We actively work with circular economy principles and responsible resource use. Our waste sorting ensures that 56.7% of the company’s waste is properly recycled. The Globe Systems Refurb program only replaces necessary parts to extend product lifespans. In 2025, we plan to implement supplier assessments to ensure that no partners operate in high-risk areas or use illegal mining practices.
We are committed to reducing our climate footprint. In 2024, we achieved a total energy reduction of 7% through energy-saving measures such as LED lighting and motion sensors. We have switched 100% of the electricity at our headquarters to green energy. Our vehicle fleet is being transitioned to electric, with the goal of reaching 100% electric vehicles by 2030. We continuously monitor our CO₂ emissions and set concrete reduction targets in line with company growth.
Closing Remarks and Focus Areas for 2025

Appendix 1 – Summary of Baseline Data
Appendix 2 – Summary of ESG Indicators 2024
Comments on the report
The report is not verified by an independent third party. Although we have made efforts to ensure that the content of the report is accurate, there is no guarantee regarding its accuracy and/or completeness, and we therefore disclaim any liability for any damage or loss that may arise from actions taken based on the report.